

Geospatial analysis with GIS

If your research involves geospatial analysis, the Leiden University Libraries’ Centre for Digital Scholarship can help. We offer information and training on the use of Geographic Information Systems (GIS). To get you started, Peter Verhaar introduces the basics in this blogpost.
The term “Geographic Information Systems” (GIS) broadly refers to any technology that can be used to describe, analyse, and visualise geographic phenomena on maps. By displaying geospatial data visually, GIS enables researchers to explore a wide range of spatial questions and patterns. Such interactive maps can reveal whether data points are concentrated within a particular region, for example. They may also illustrate the historical expansion of cities, or uncover complex migration patterns over time.
Most GIS tools are designed to work with datasets containing geographic coordinates. In two-dimensional digital maps, locations are typically defined through two numbers: the latitude and the longitude. In three-dimensional systems, a third coordinate may be added to represent elevation or height. Geospatial datasets often contain additional information linked to these coordinates, such as place names, demographic statistics, or historical data.
Simple geographic datasets describing individual points can easily be stored in CSV files or spreadsheets. Such tabular datasets usually contain at least three columns: the latitude, that longitude, and the name of the location. More complex geographic entities such as countries, provinces, rivers, or mountain ranges are generally represented as polygons composed of many different geographic coordinates. These polygons, also known as vectors, can be stored in several specialised file formats.
One of the most widely used formats is shapefile, which supports the representation of points, lines, and polygons, together with descriptive attributes such as names, regions, or population density. Other commonly used geospatial formats include the Keyhole Markup Language (KML) and GeoJSON. User-friendly platforms such as GeoJSON.io allow users to draw polygons manually and to export them directly as GeoJSON files.
Creating accurate boundaries for countries, states, or continents manually can evidently be very time-consuming. Fortunately, many organisations provide access to freely downloadable vector and raster datasets. Useful sources include Geobounderies, QuickMapTools, Natural Earth Data, and GADM.
Most GIS applications organise maps into separate layers. At the foundation of a digital map is usually a high-resolution image of the area being represented. To be able to plot geographic data accurately, this image must have been georeferenced. Georeferencing is the process of linking positions on an image to real-world geographic coordinates, ensuring that each pixel corresponds to a specific location on Earth.
The Allmaps platform provides access to thousands of georeferenced historical maps.
Go to the Allmaps platform
Many modern digital maps are also “tiled,” meaning that they consist of numerous smaller images displayed dynamically depending on the user’s zoom level. Some tiles may display entire countries, while others may focus on cities or streets. Users only load the tiles required for their current view, which makes interactive maps significantly faster and more efficient.
Create interactive maps using Leaflet
Interactive maps can be created using a wide variety of software applications. One widely used tool is Leaflet, an open-source JavaScript library developed by the Ukrainian programmer Volodymyr Agafonkin. Leaflet has been integrated into several popular GIS platforms such as Carto and Recogito. It is also used on Pinterest and on the website of the United States Geological Survey.
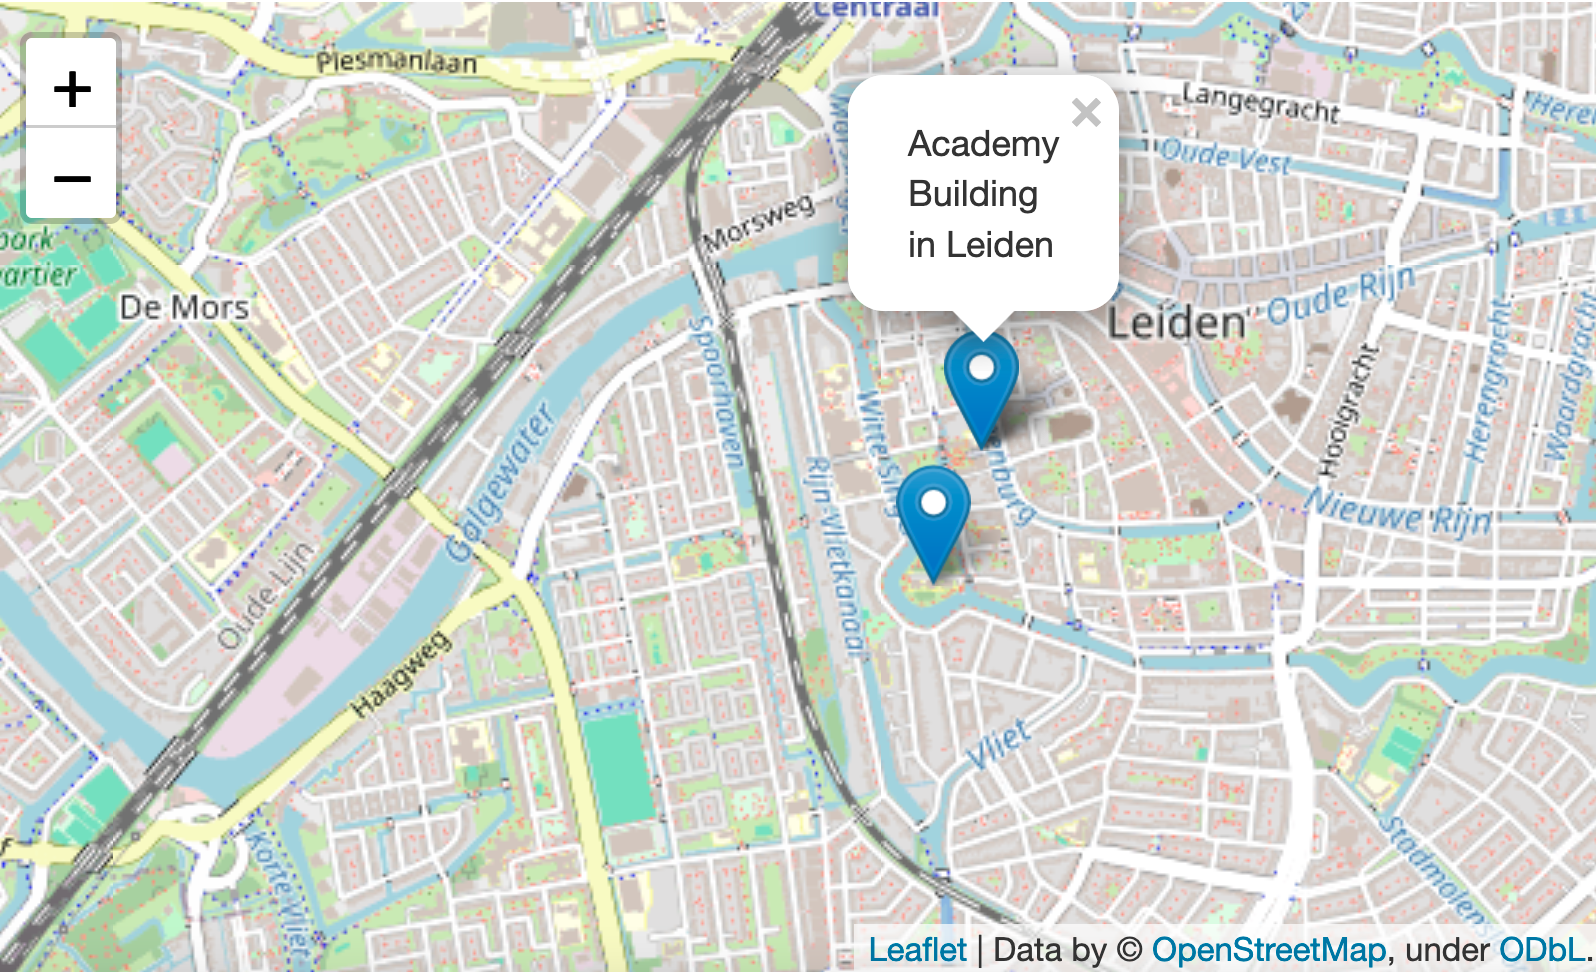
In Leaflet, it is possible to work with a broad range of openly available base maps provided by organisations such as OpenStreetMap, ESRI, the U.S. Geological Survey, and the National Library of Scotland. After selecting a base map, users can add markers, circles, lines, and other visual elements on separate layers to represent locations and geographic features. Markers can also contain popup windows displaying additional contextual information.
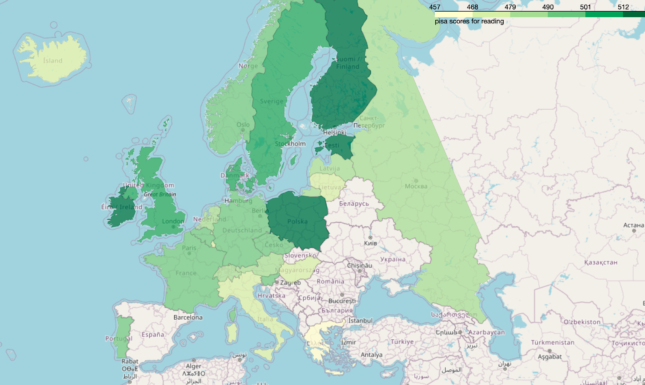
One of Leaflet’s greatest strengths is its support for GeoJSON. GeoJSON files can be imported directly into a map, allowing users to visualise complex geographic regions together with associated datasets. This functionality makes it possible to create so-called choropleth maps: thematic maps that use colours or colour gradients to represent statistical values across regions. Choropleth maps are especially useful for comparative analyses because they allow users to identify regional patterns at a single glance.
The choropleth map below visualises reading proficiency scores across European countries based on data from OECD’s 2018 PISA programme. The GeoJSON file describing the political boundaries of European countries has been downloaded from the Eurostat GISCO database.
Because Leaflet is a JavaScript library, some familiarity with JavaScript is useful when creating maps directly. However, users with experience in Python can simplify the process considerably by using Folium, a Python package that acts as an interface to Leaflet. With only a limited number of Python commands, Folium enables users to build sophisticated interactive maps. The CDS team has created an in-depth tutorial designed to guide users through the process of building interactive maps with Leaflet and Folium.
QGIS
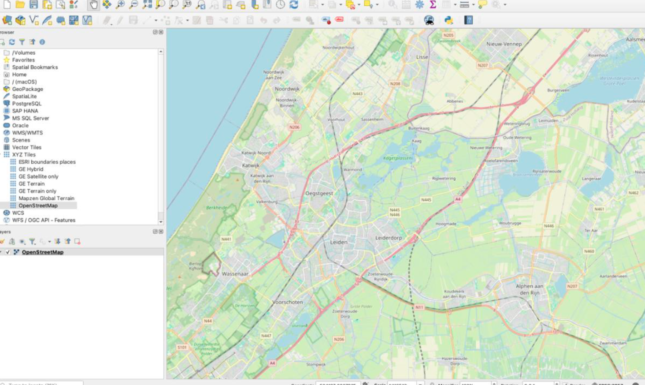
Another important open-source GIS application is QGIS, a free platform for creating and analysing digital maps. As in Leaflet, the process typically begins by selecting a suitable base map. QGIS allows users to import georeferenced maps from providers such as OpenStreetMap, Google Earth Satellite, ESRI Topo World, and Bing Maps. Within QGIS, users can easily add points, lines, and polygons, and the tool provides support for many geospatial formats, including shapefiles, KML, and GeoJSON. While Leaflet primarily focuses on the creation of interactive web-based visualisations, QGIS can be used very effectively to create high-quality static maps suitable for inclusion in publications or presentations. Comprehensive documentation and tutorials for QGIS can be found in the QGIS Training Manual and on the QGIS Tutorials website. To get started, you can use our CDS tutorial on making simple maps in QGIS.
If you have any questions about GIS, or if would like a more detailed demonstration of either Leaflet or QGIS, please do not hesitate to contact the CDS team at cds@library.leidenuniv.nl.
This blog was reviewed and edited by Pascal Flohr and Tessa de Roo. The blog content was created exclusively by humans without the use of generative AI systems (declared under the FAIA framework (faia.io)).